Agata Engelman
about
contact
life does not frighten me
SVLBRD
albedo
eye for an eye
boat
plane
waterfall
storm
The Great Flood 7209
prayers
yellow sky
[untitled]
soundtrack
piernik
research
A0 pentaptych
Shh.. my child, I will make your love eternal
When the ice is gone, we are left in the dark.
Albedo is the reflection coefficient of a surface, it indicates how much energy coming from the...
During my residency at DAR I made a word cloud out of comments people leave below articles about the shoot-on-sight policy at the Kaziranga National Park...
short video
short video
happening
short video
short video
church prayers typed from memory using a faulty typewriter
short video
four short 6-screen videos
soundtrack to a taxi journey
table, gingerbread, framed photo, writing on a wall
Tomorrow in a year. The politics of Ips typographus.
In my doctoral project I look at the conflict surrounding the protection of Poland's Bialowieza Forest...
albedo
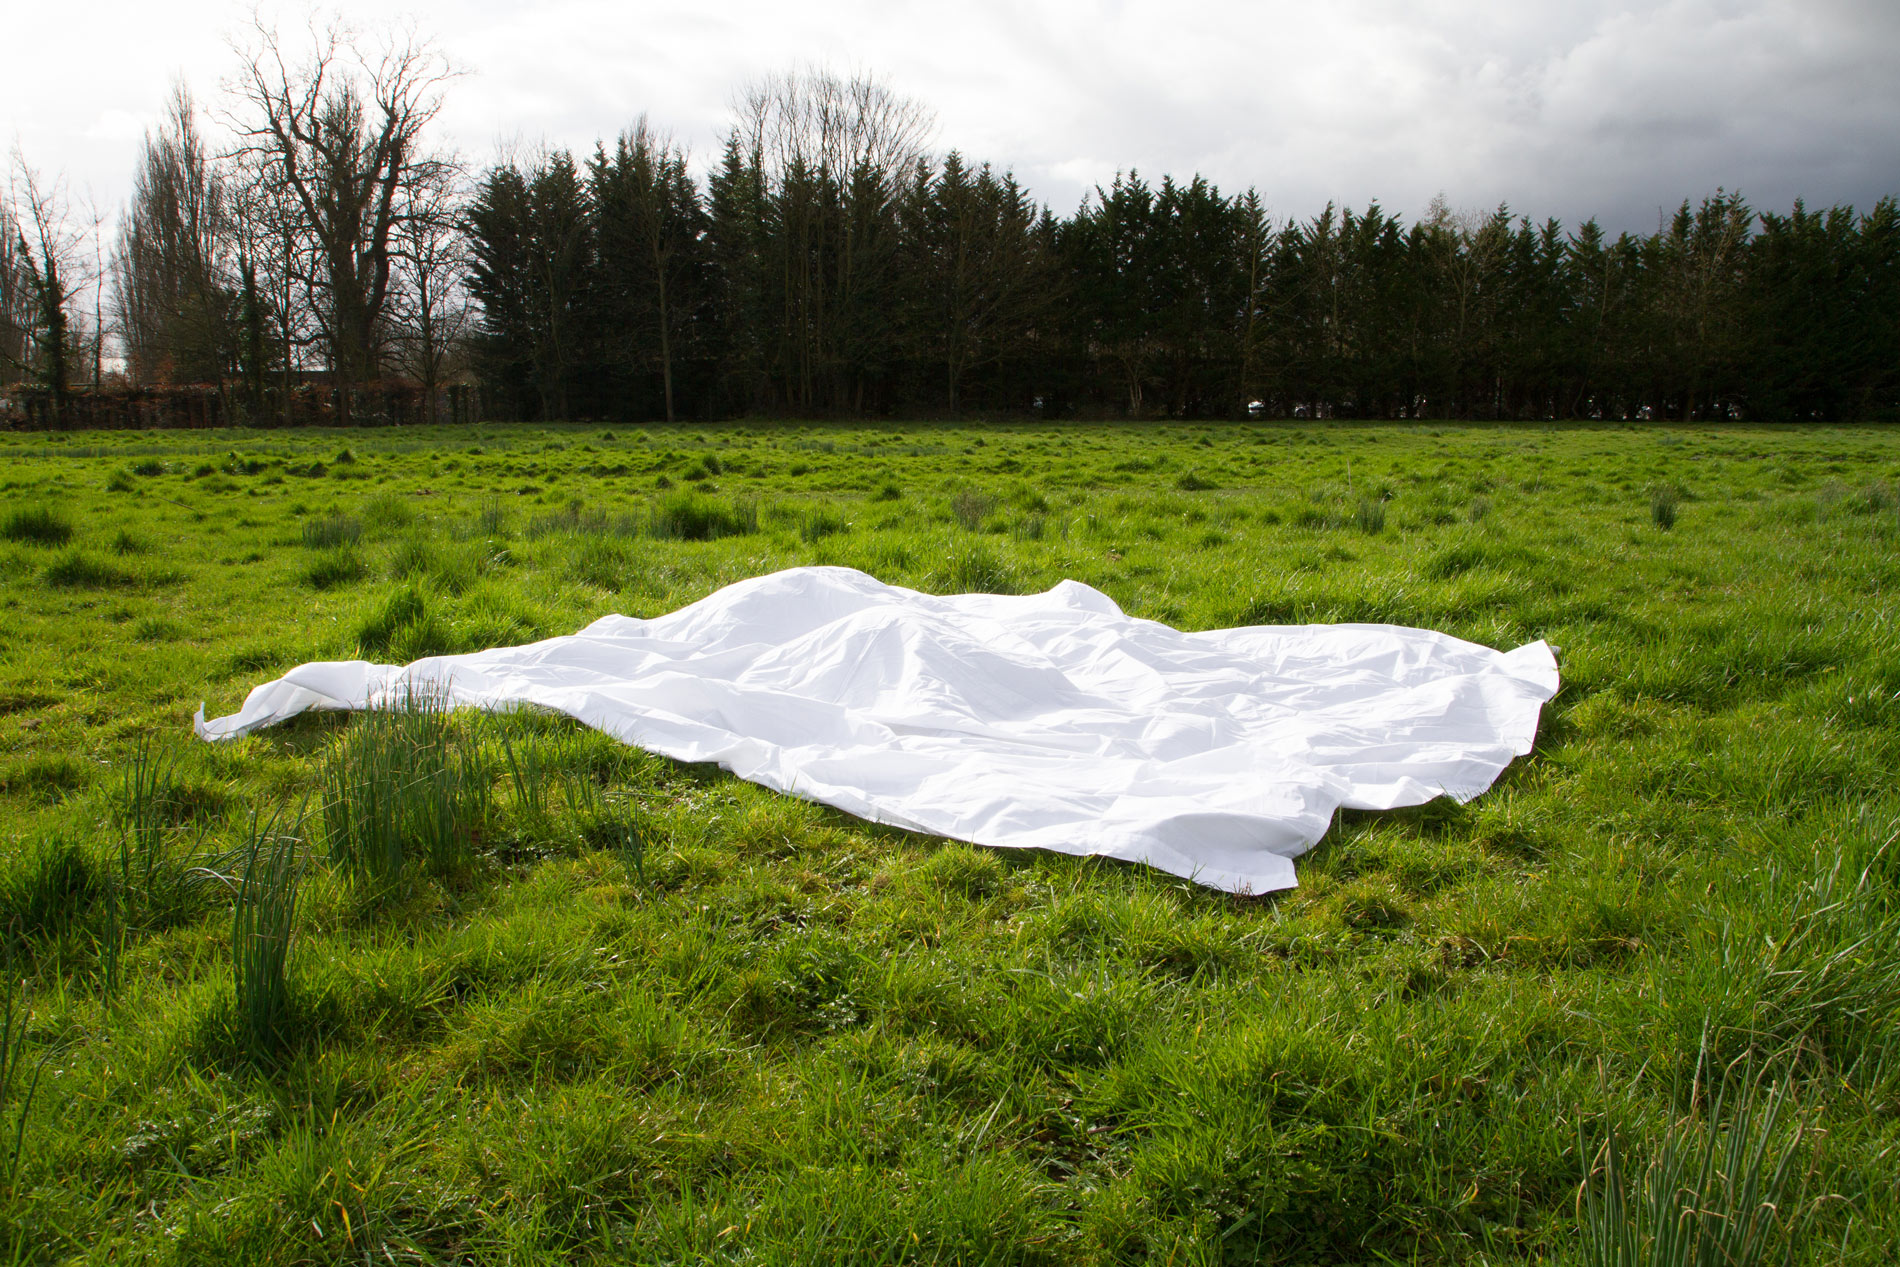
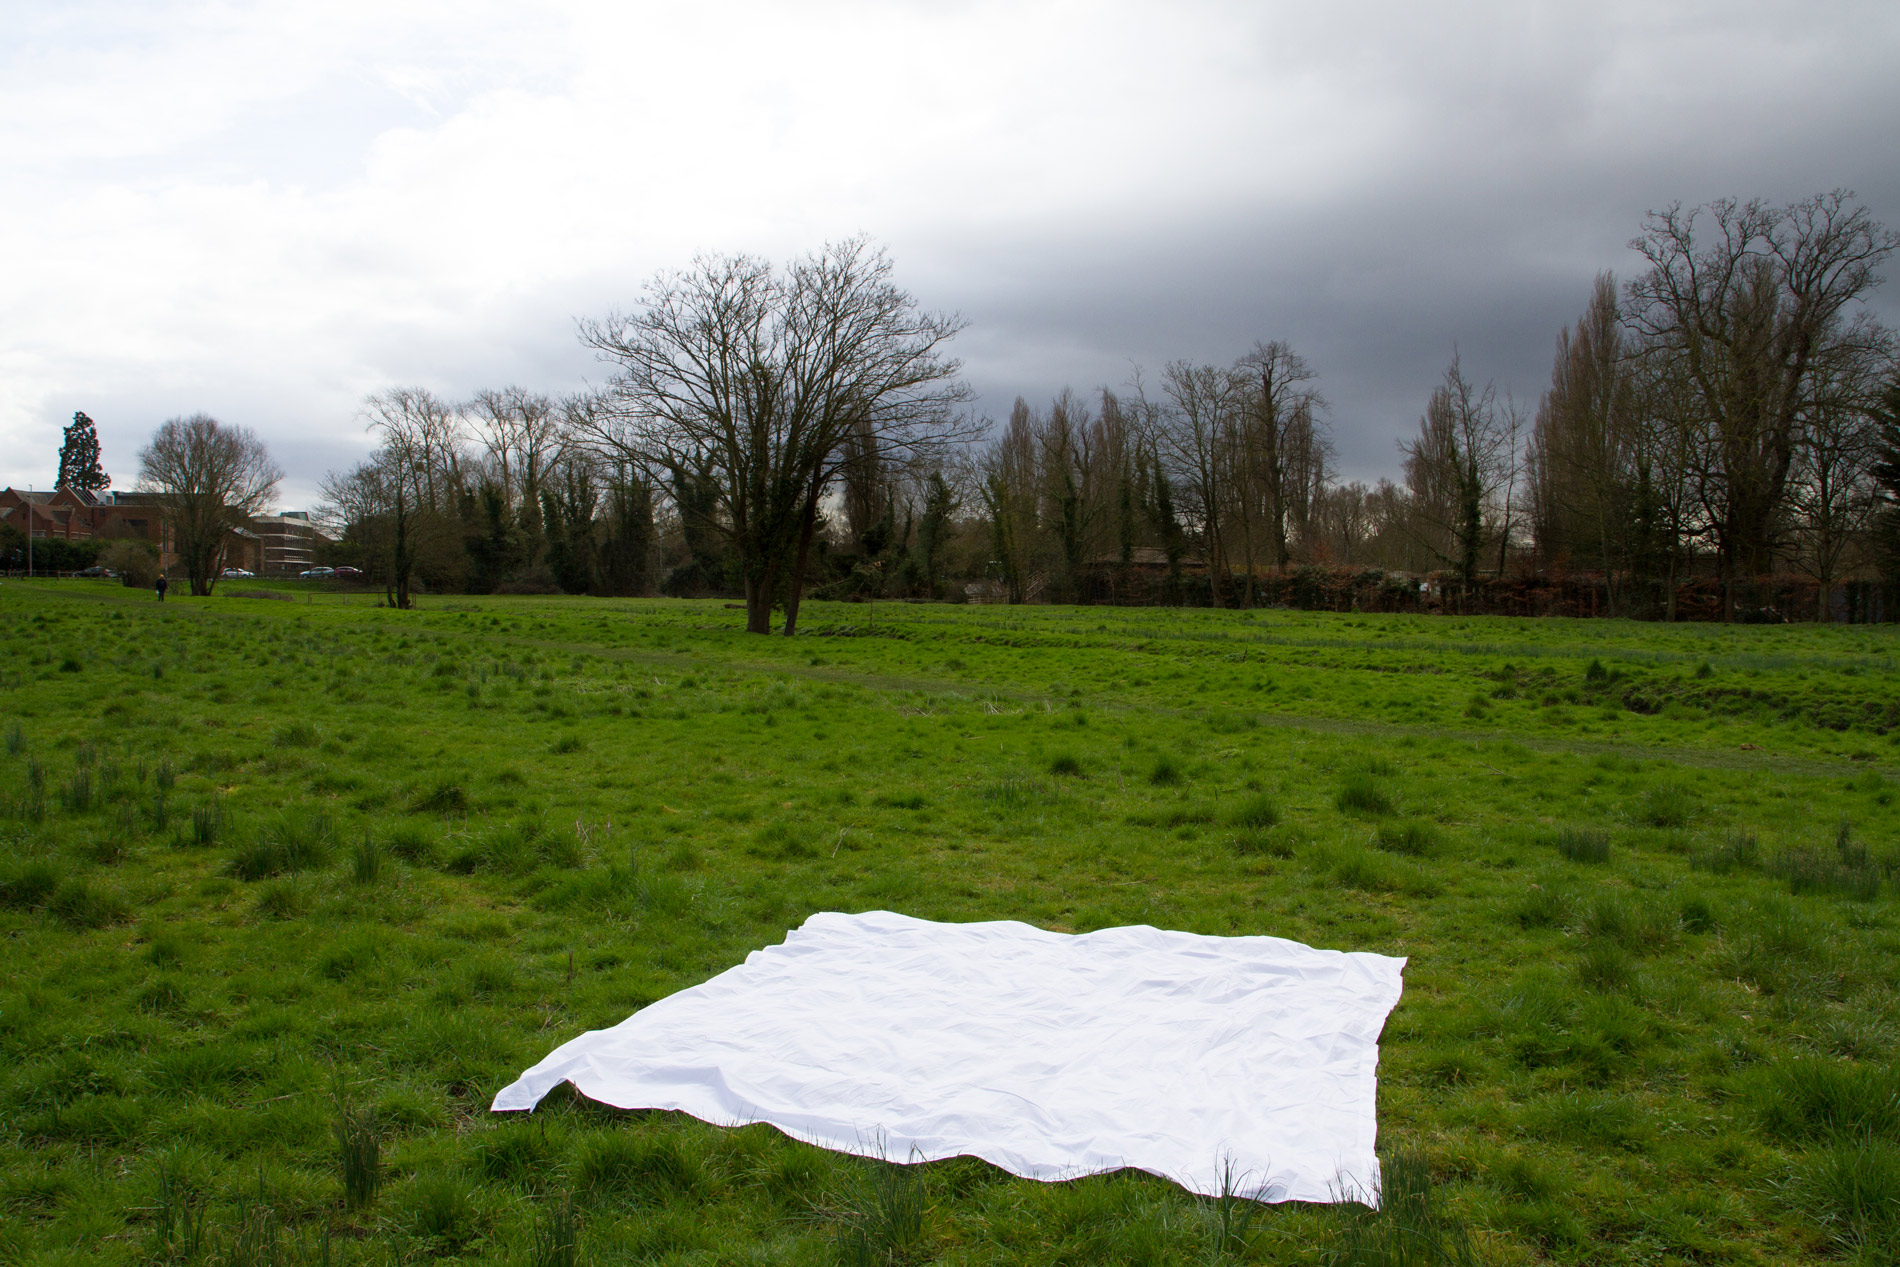
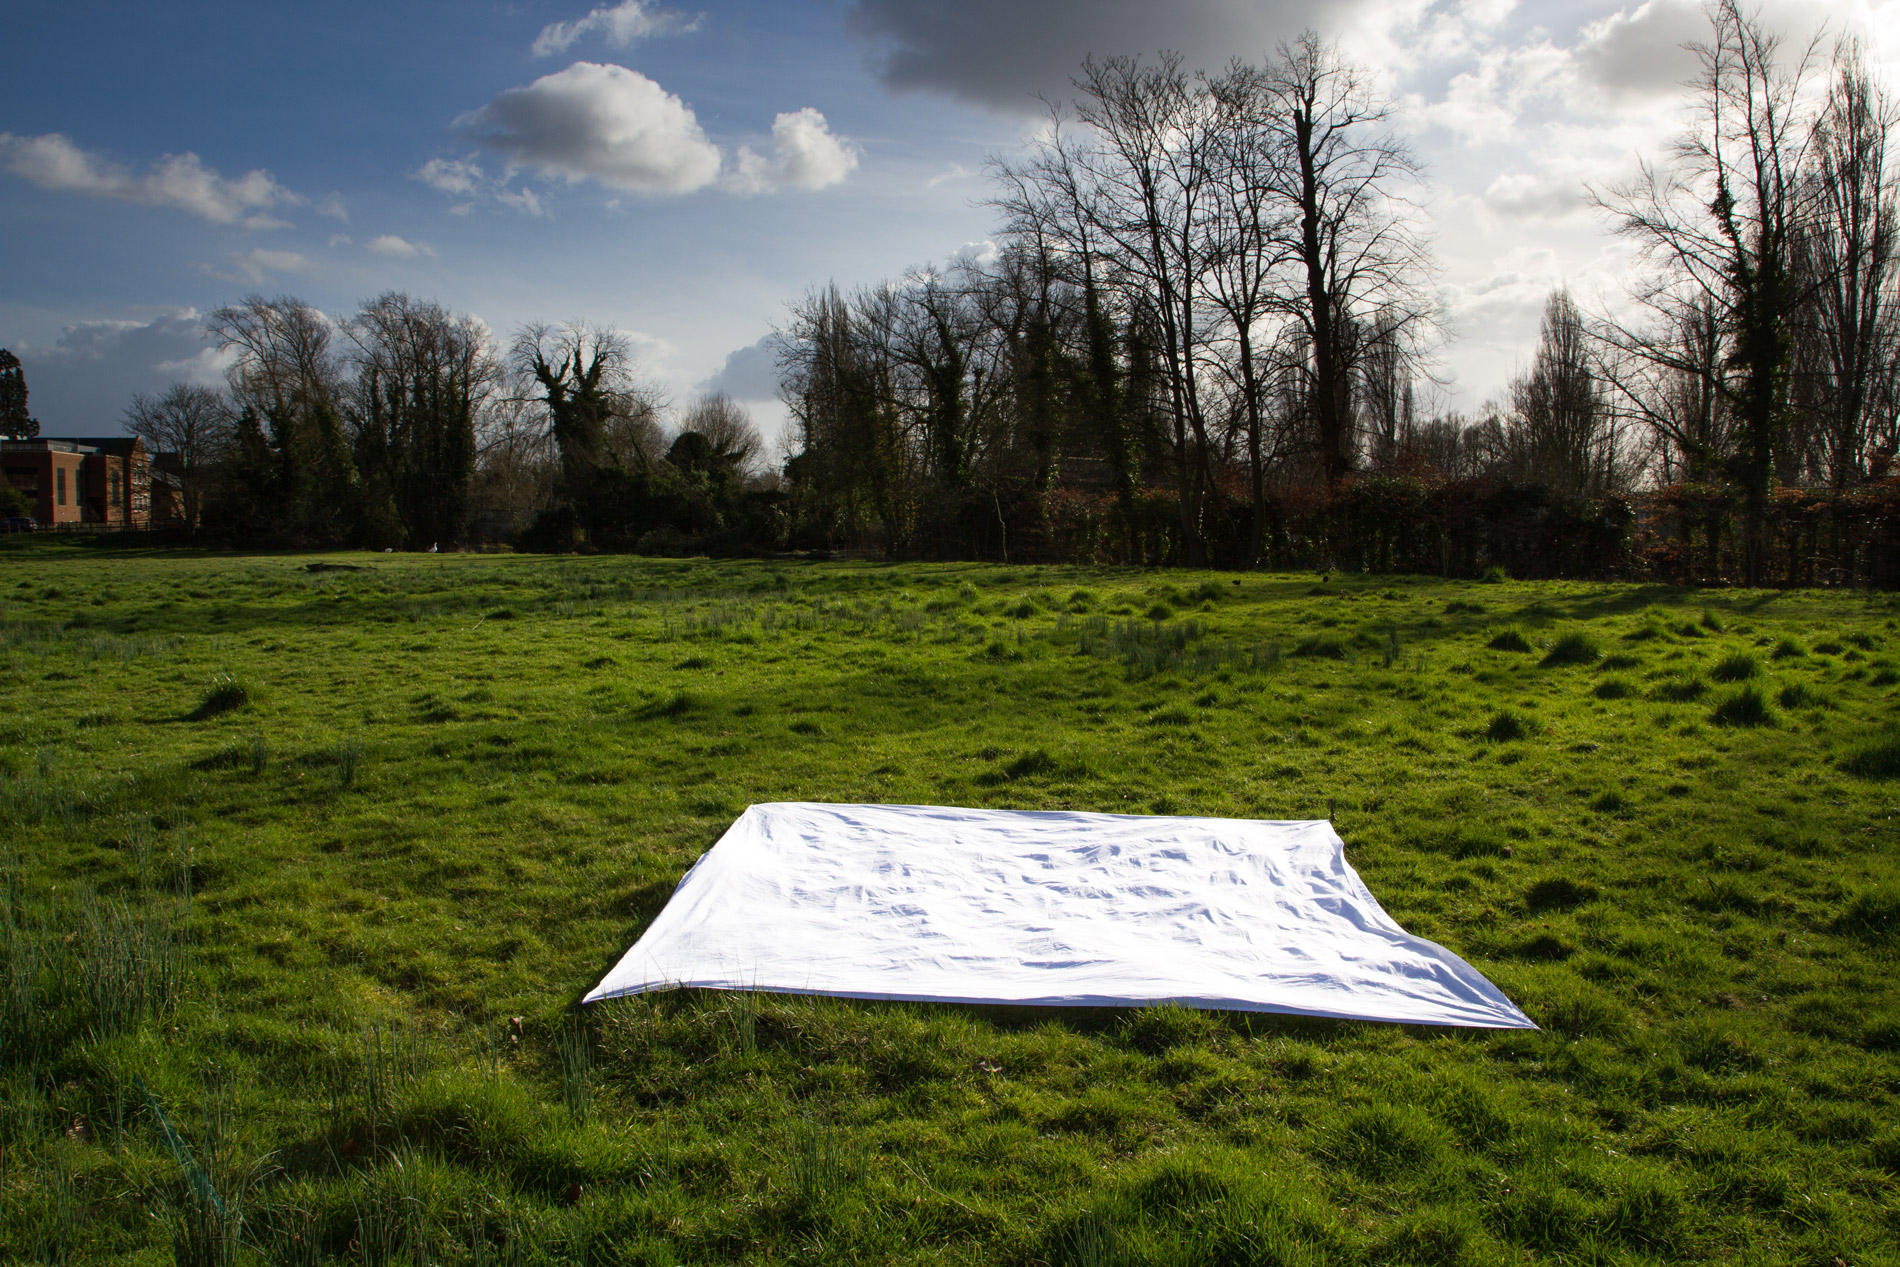
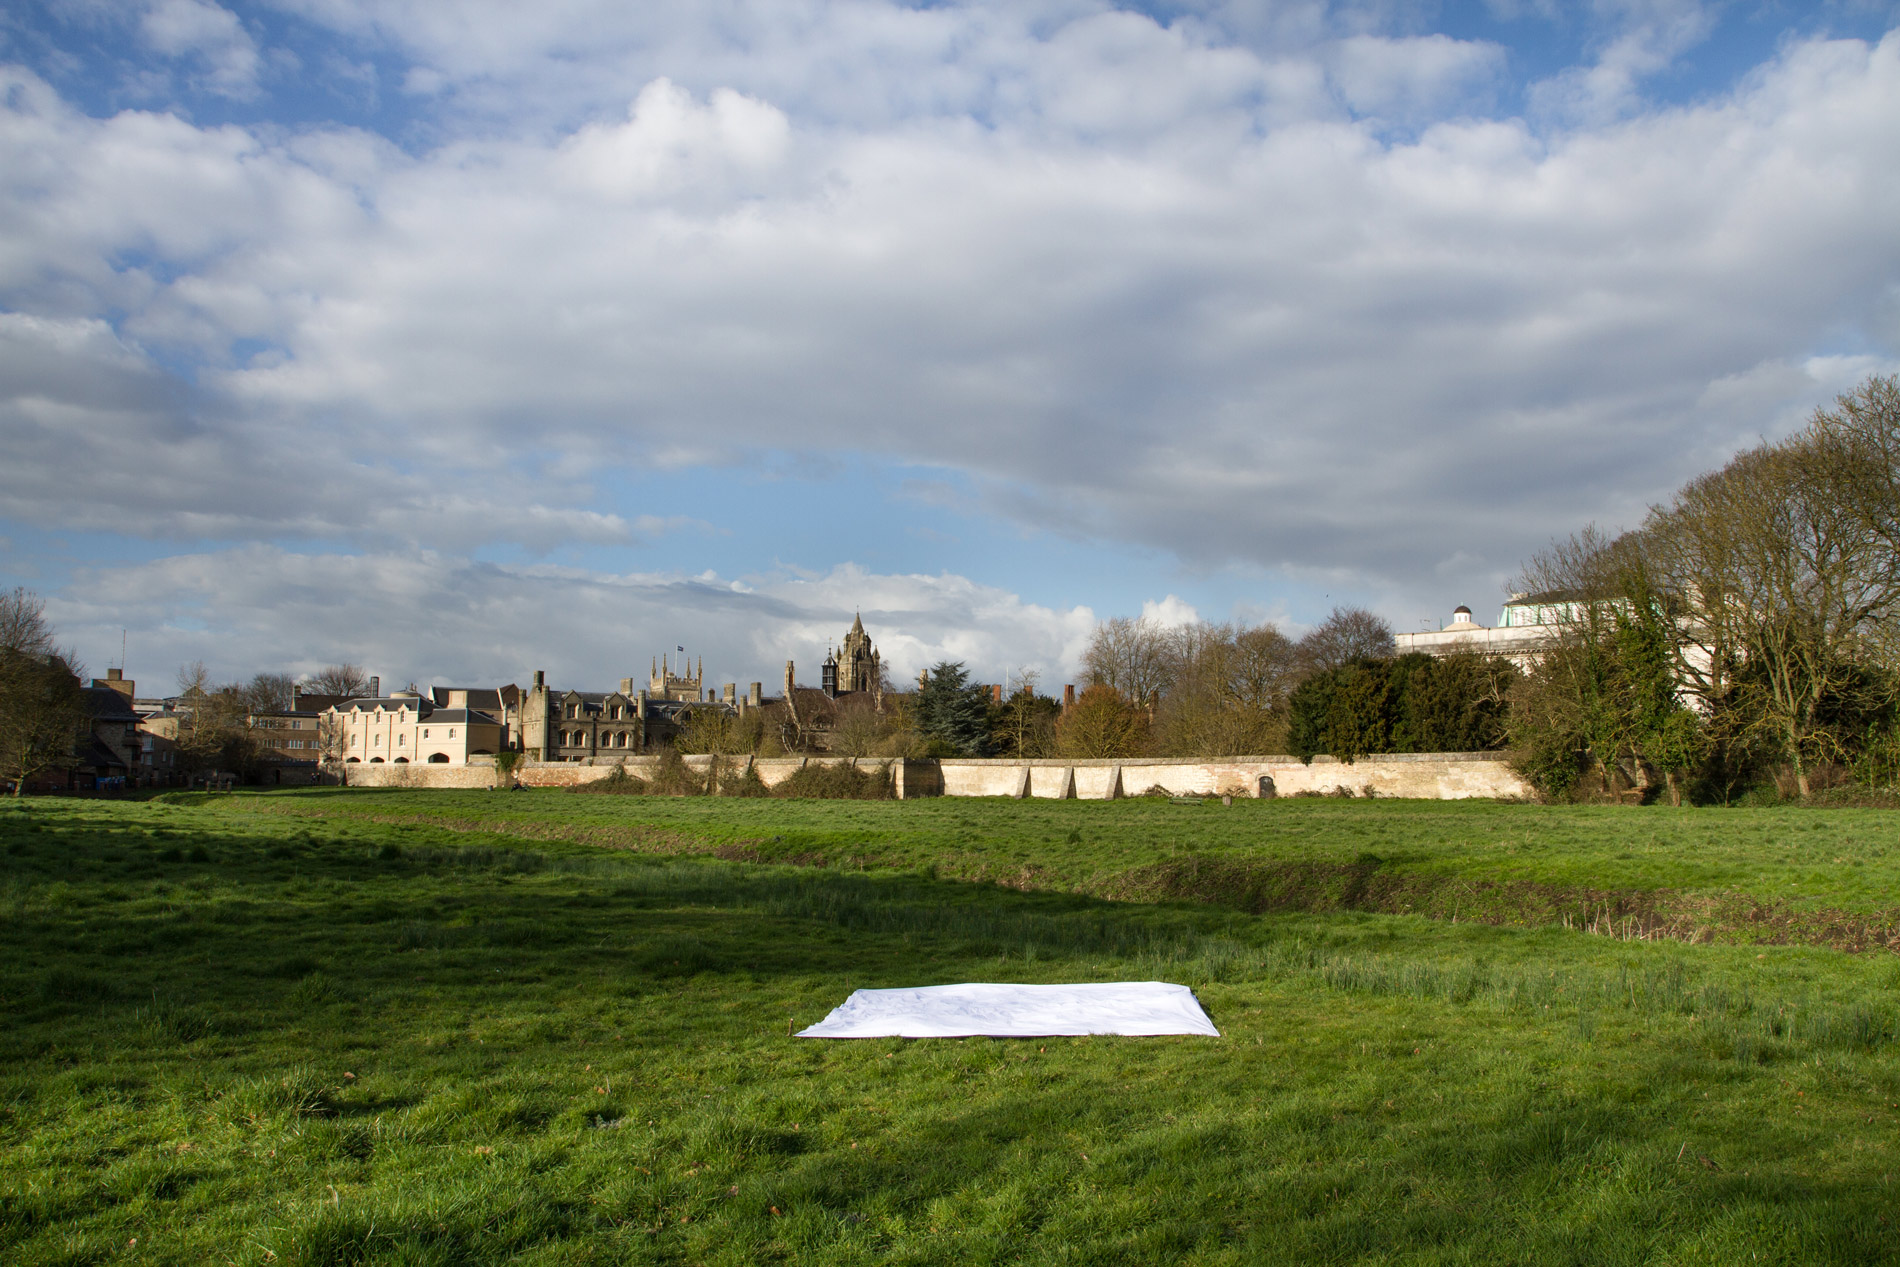
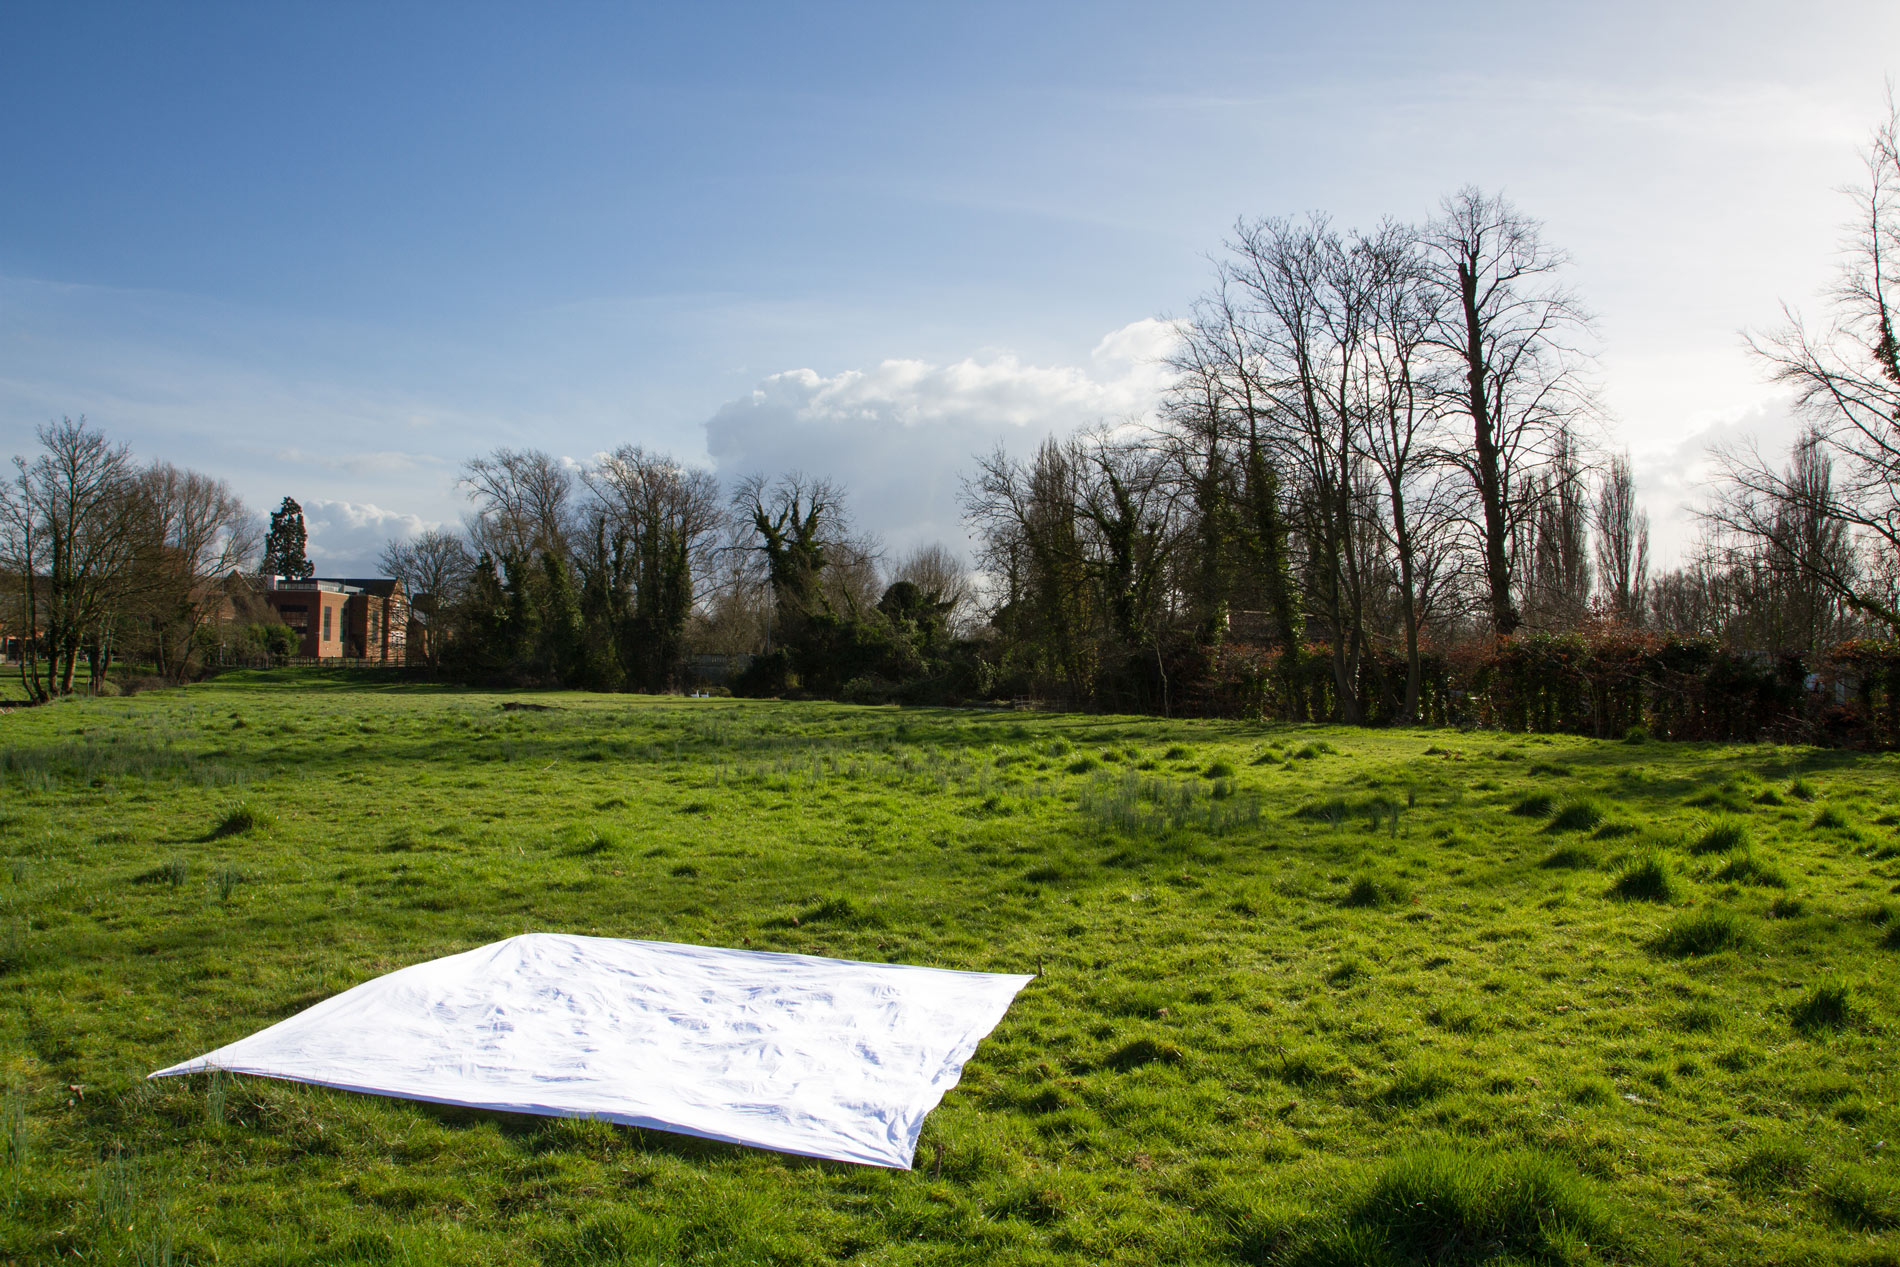
digital photographs documenting an outdoor installation, 2017
digital photographs documenting an outdoor installation, 2017
When the ice is gone, we are left in the dark.
albedo was featured in issue 7 of Novelty Magazine
If all the estimated 7.49 billion people living on the planet at the moment wanted to mitigate the February 2017 loss of white sea ice in the Arctic, we would each have to cover an area of over 6 square meters with a white sheet.
Albedo is the reflection coefficient of a surface, it indicates how much energy coming from the sun will be reflected back and how much will be absorbed, mainly as heat. Ice and snow have high albedo, whereas seawater reflects very little sunshine and, therefore, its albedo is much lower. Absorbed radiation contributes to warming of the sea and further retreat of sea ice, thus creating a feedback cycle. With ice covers disappearing, Earth is becoming darker and warmer.
The extent of Arctic sea ice has been monitored using satellites since 1978. Areas with at least 15% of ice are counted as ice-covered. Since then, a steady downward trend has been documented, confirming previous observations. The change is most radical in the months at the end of the melting season, August and September, and it seems we will soon see a completely ice-free summer in the Arctic. In 2016, the linear rate of decline for September was 13.3 percent per decade since 1978. That means that for the last 38 years, each September saw on average 87,200 square kilometers of sea ice less than the one before - a patch 3,000 square kilometers larger than Ireland (entire island) disappearing every year. It also means that since 1978 the September extent of sea ice shrank by over 50%.
February and March is when the sea ice extent is the largest. February 2017 was the fifth month with record-low sea ice extent in a row, a trend that started with October last year. March has only just started. For February, the linear rate of decline is smaller, at 46,900 square kilometers per year, or 3 percent per decade over the last 38 years. Still, that is significantly more than the size of Estonia disappearing every year.
The rapid changes have a massive impact on the entire Arctic ecosystem, the global climate, and economy. Less ice also means people can drill for oil and send ships through passages that used to be blocked by pack ice, further changing the area.
Human contribution to the changing climate, particularly via CO2 emissions, has been proven time and again beyond reasonable doubt. The blame is at once easy and difficult to place. Between the citizens of most developed countries whose consumption fuels global corporations, various groups of interests in the richest 1%, countries that fail to comply with regulations, the list goes on; some people are more to blame than others, maybe some aren't at all.
---------------------------------------------------------------------------------------------
Through 2017, the linear rate of decline for January is 47,400 square kilometers (18,300 square miles) per year, or 3.2 percent per decade.
Through 2016, the linear rate of decline for December is 44,500 square kilometers (17,200 square miles) per year, or 3.4 percent per decade.
Through 2016, the linear rate of decline for November is 55,400 square kilometers (21,400 square miles) per year, or 5.0 percent per decade.
Through 2016, the linear rate of decline for October is 66,400 square kilometers (25,600 square miles) per year, or 7.4 percent per decade.
Through 2016, the linear rate of decline for September is 87,200 square kilometers (33,700 square miles) per year, or 13.3 percent per decade.
Through 2016, the linear rate of decline for August is 10.4 percent per decade.
Through 2016, the linear rate of decline for July is 72,700 square kilometers (28,070 square miles) per year, or 7.3 percent per decade.
Through 2016, the linear rate of decline for June is 44,600 square kilometers (17,200 square miles) per year, or 3.7 percent per decade.
Source of data: nsidc.org
